Turn field data into
decisions instantly.
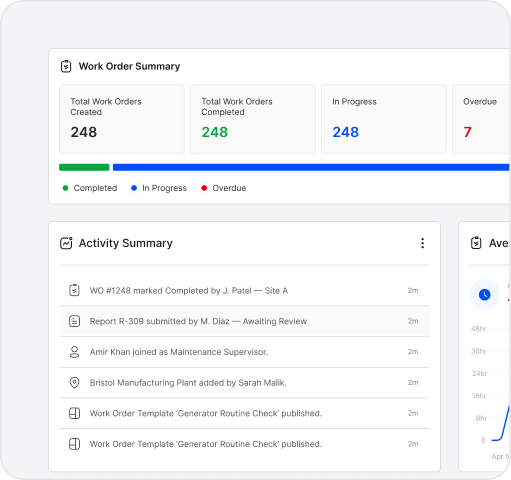
Auto-generating reports and real-time dashboards give teams the clarity they need. Track trends, identify risks, and share insights with supervisors or clients in seconds.
- Auto reports
- Real-time KPIs
- Export & share
Make decisions backed by real time operational data.
Manual reporting wastes time and hides patterns teams need to understand.
Common challenges
Delayed reports, inaccurate spreadsheets, and no unified view of trends, risks, or bottlenecks.
Our Feature Delivers
- ✓Instant, auto-generated reports
- ✓Dashboards with live KPIs and trends
- ✓Export-ready insights for audits and leadership
- ✓Custom views for each team or department
Everything you need to turn data
into action.
Instant, customizable dashboards and reports that help teams make faster, informed decisions.
RealTime Dashboards
Track KPIs live across sites, assets,
or teams.
Custom Views
Create department
specific dashboards.
Exception Reporting
Highlight outliers and unusual activity.
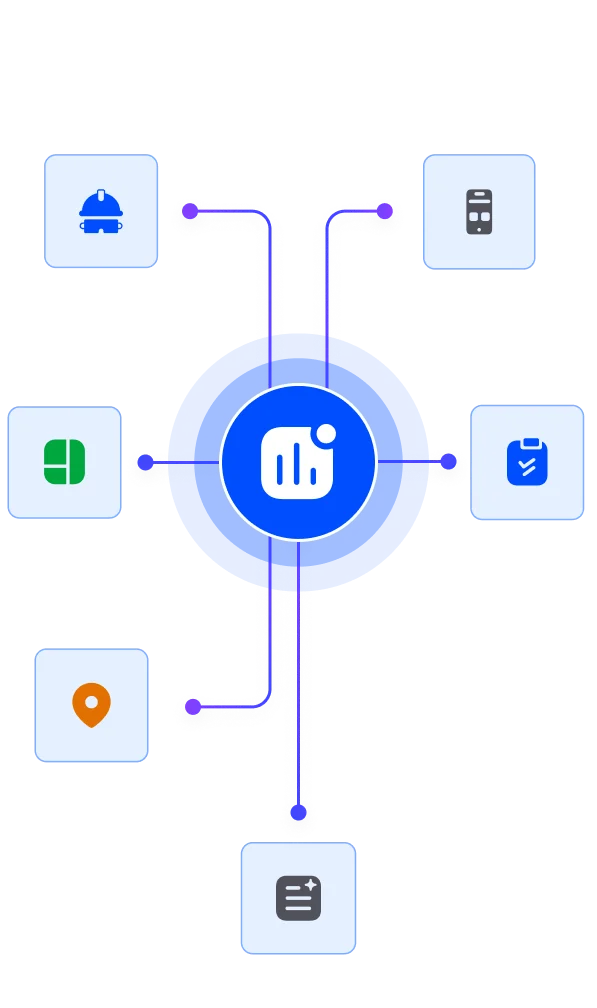
Cross Feature Insights
Pull data from templates, assets, and work orders into one unified view.
See the impact of instant insights and real time reporting.
Teams move from reactive decisions to proactive management with data that’s always up to date.
0%
Reduction in manual reporting time
0%
Faster decision-making using live dashboards
0%
Improvement in identifying risks
before escalation
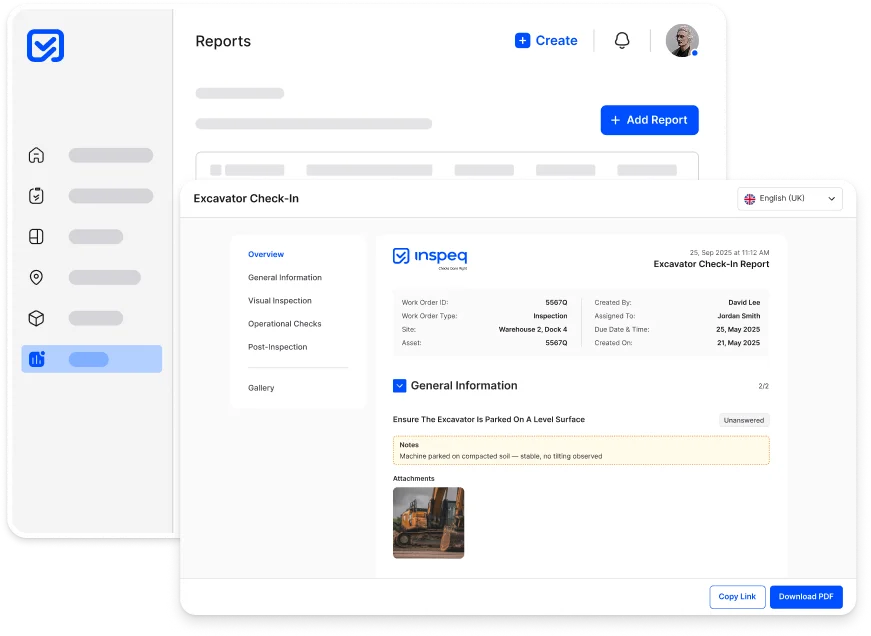
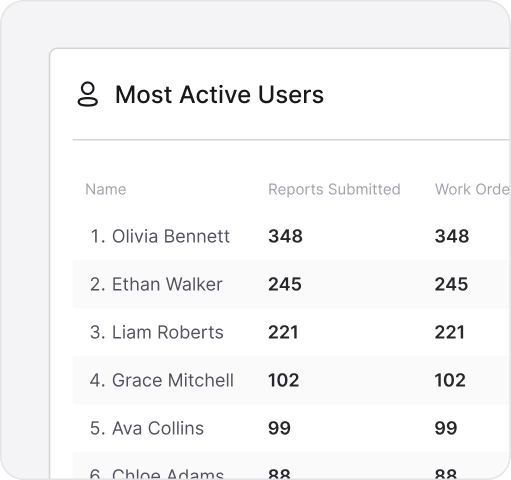
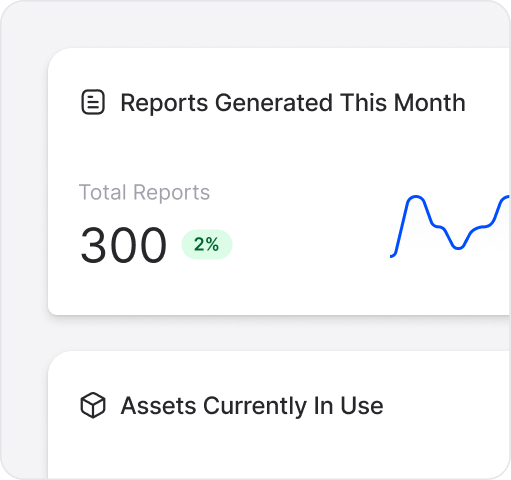
Insights that turn field data into action.
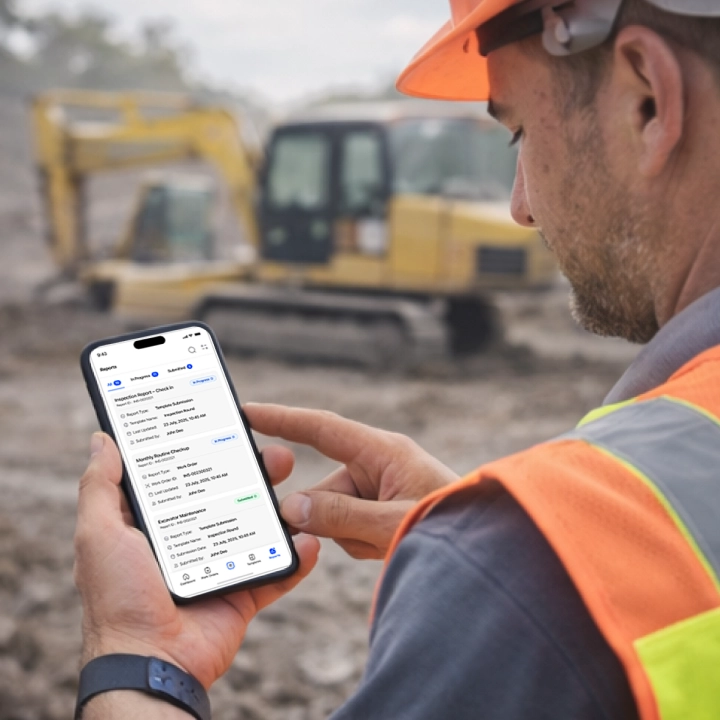
Generate detailed inspection reports, track KPIs, monitor field activity, and visualize trends through live dashboards. Every data point rolls up into clear, actionable intelligence.
How customers run work orders in Inspeq.
See how different industries use Work Orders alongside inspections and asset management.
Mining
IronVale Mining
Challenge
Lack of visibility into key metrics slowed decision-making.
Solution
Inspeq dashboards show live KPIs and trends across sites.
Result
- Operational decisions speed increased 37%
- KPIs tracked in real-time
- Bottlenecks identified immediately
“We can see everything live now. Game-changer.”
Rian Locke, Operations Lead
Manufacturing
CoreForge Industries
Challenge
Plant managers lacked actionable insights from scattered data.
Solution
Inspeq provides visual dashboards and automated reports.
Result
- Decisions faster 39%
- Productivity insights accurate 44%
- Waste reduced 31%
“Our managers act on insights immediately now.”
Isla Rowan, Plant Manager
Automobile & Dealership
VelocityDrive Motors
Challenge
Sales and service data were delayed, preventing quick action.
Solution
Inspeq dashboards consolidate metrics for live decision-making.
Result
- Actionable insights up 52%
- Customer issues resolved faster 37%
- KPI visibility 100%
“We respond to customers faster than ever.”
Kaia Mercer, Operations Director


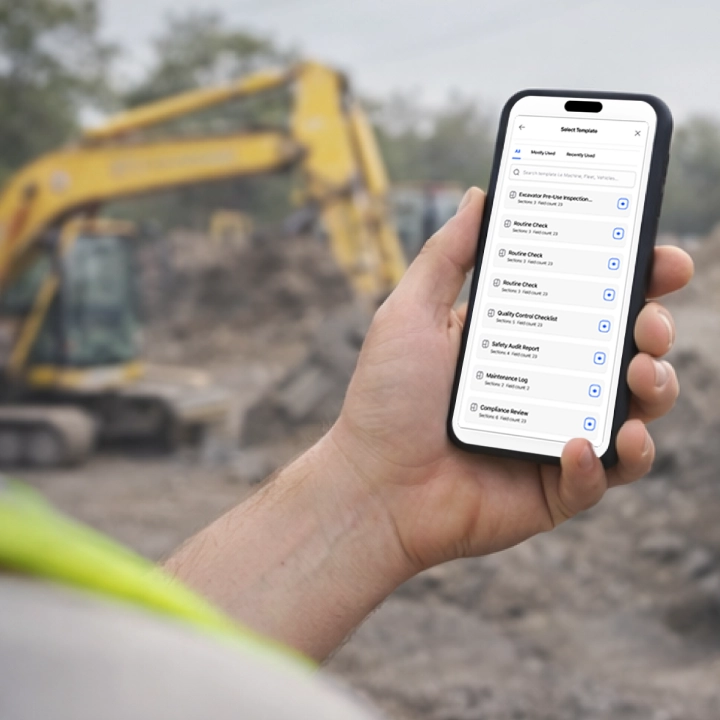
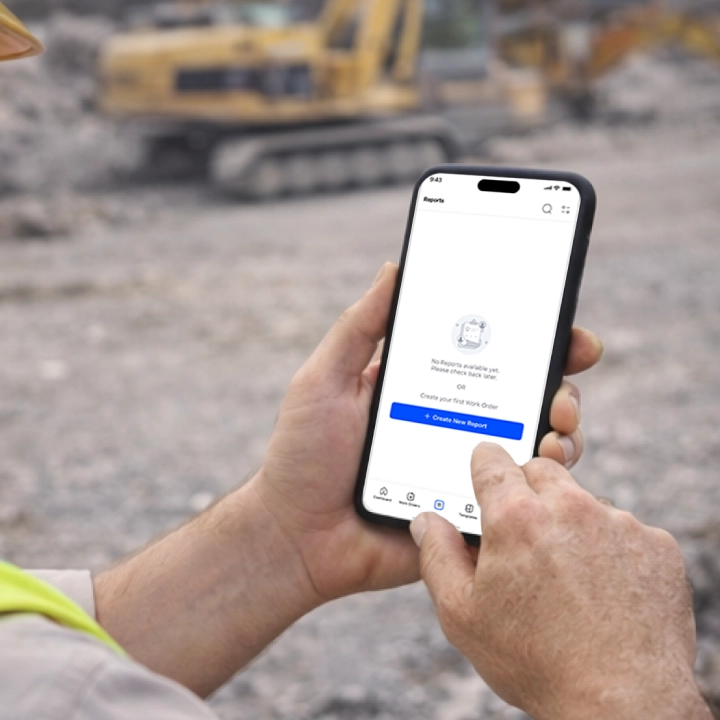
A mobile app built for
modern operational teams
Inspeq’s mobile app enables teams to execute work with speed and accuracy, whether in the field, on the shop floor, or across distributed sites.


Questions answered
We’re here to help you and solve objections. Find answers to the most common questions below.
Reports are generated automatically from daily operations no manual data entry.
Yes but you need to contact our sales team for custom dashboards.
Dashboards update instantly whenever new data is submitted.
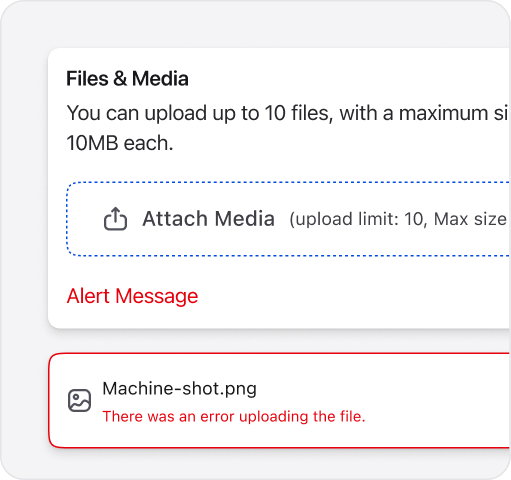
PDF, CSV, and shareable links are supported.
Yes — weekly, monthly, or custom intervals.
Absolutely. Track productivity, compliance, risks, and operational metrics.
Yes. Multi-site and multi-asset comparisons are built-in.
Inspeq can flag unusual data, trends, or deviations.
Still have questions?
Our team is here to help. Get in touch and we'll answer any questions you have.